ANOVA-A (Key Even)
12.2 Bronchial reactivity.
(A) Explore the data with side-by-side
boxplots. Not yet done.
(B) Test the means for a difference with a one-way ANOVA procedure. Descriptive
statistics are
n Mean StdDev
SO2 5 18.840 9.692
NO 6 6.617 3.945
O2 4 4.975 3.409
Total 15 10.253
- Testing H0: �1 = �2 = �3 vs. H1: at least one population mean
differs
- SSB = (5)(18.84 - 10.253)2 + (6)(6.617 - 10.253)2 + (4)(4.975 - 10.253)2 = 559.435
with dfB = 3 - 1= 2 and s2B = 559.435 / 2 = 279.717
- SSw = 488.418 with dfw = 15 - 3 = 12
and s2w = 488.418 / 12 = 40.702
- Fstat = 279.717 / 40.702 = 6.87 with 2 and 12 df; P = .010.
- Comment: Sample variances differ by quite a bit and Levene's test produces P =
0.06, making
ANOVA suspect. Maybe a non-parametric is warranted?
12.4 Fever reduction. Conduct an ANOVA.
- SSB = 5.6575 with dfB = 2 and s2B = 2.829
- SSW = 5.2056 with dfW = 12 and s2W = 0.4338
- Fstat = 6.52 with 2 and 12 df, P = 0.012
Interpret your results. The ANOVA show the differences to be significant.
12.6 Maternal smoking 1. Stemplots were not
requested by are helpful in getting organized.
4|
5|
6| 29
7| 45
8| 3
9| 2
�10
Group 1 (non-smokers) |
4|
5|8
6|
7| 138
8| 2
9|
�10
Group 2 (Ex-smokers) |
4|7
5|89
6|22
7|
8|3
9|
�10
Group 3 (< half) |
4|9
5|478
6|228
7|1
8|
9|
�10
Group 4 (> half) |
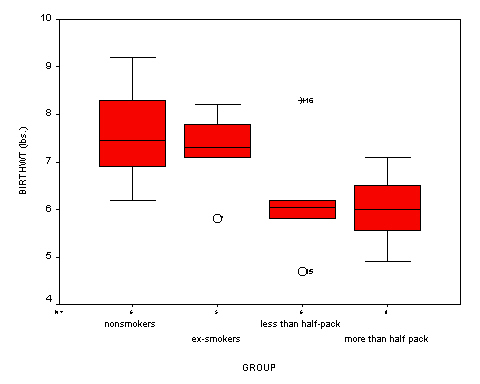
(A) Explore the data with a side-by-side boxplot. The
boxplots are shown below. Because of the small ns it is hard to say
anything other than group 1 and group 2 seem to have higher averages than groups 3 and
4. The three outside values warrant further scrutiny.
(B) Conduct an ANOVA.

(C) ...discuss your findings.
- Testing H0: �1 = �2 = �3
= �4
versus H1: at least one population mean differs
- Fstat = 4.15 w/ df1 = 3 and df2 = 21; P
=
0.019.
- The difference is
significant, confirming non-random differences
among the groups.
- The descriptive statistics should be discussed in this context.