|
|
INCIDENCE & PREVALENCE EXERCISES
Ch 6 in 2e� �������������������� Ch 3 in 3e
6.1 - 6.9 See text.
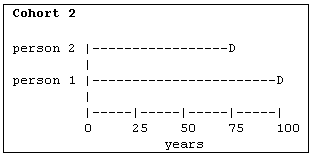
6.10 Mortality and life expectancy. The person-time schematics below represent the survival experience of two cohorts. Each line represents an individual; D represents death.
(A) Calculate the mortality rate and life expectancy in cohort 1. Note: Since all subjects are followed until their demise, life expectancy can be calculated as the average lifespan; it is also the inverse (reciprocal) of the mortality rate.

(B) Here is the
experience of a different cohort. Calculate the mortality rate and life
expectancy in this group.

(C) How doe the experiences of cohort 1 and cohort 2 compare?�
6.11 Twice the prevalence. The prevalence of
a condition in population A is 20 per 100,000. The prevalence in population B
is 10 per 100,000. The groups have identical age distributions. Can we conclude
that population A has twice the risk compared to group B? Explain.
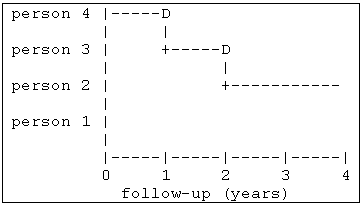
6.12 Person-time and survival.
This exercise will demonstrate the relation between person-time and a
Kaplan-Meier survival curve is a cohort with no loss to follow-up and no
competing risk.
(A) Talley the person-time in this cohort.
(B) This second schematic has been modified to emulate a Kaplan-Meier curve. Based on this curve, what percentage of the cohort survived two years?� What percentage survived four years?��
(C) The area under the above Kaplan-Meier survival curve is equivalent to the person-time in the cohort. Determine the total person-years in the cohort by use geometry to determine the total area under the curve. You can do this by dividing the areas under the curve into rectangular segments of known height and base and then summing the different segments. For example, between year 0 and year 1, the curve comprises a rectangle with a base 1 and height 4, and has area = 1 year � 4 persons = 4 person-years.
6.13 Breast cancer. A cohort study starts with 10,000 women. Of these, 500 experienced breast cancer sometime in their past. The remaining 9,500 are followed for five-years. Two-hundred fifty breast cancer cases occurred during the 5 years of follow-up. Assume there was no loss to follow-up and no competing risk.
(A) What is the five-year risk of breast cancer? Report the risk per 1000 people.
(B) What is the incidence rate of breast cancer in this cohort? Report the rate per 1000 person-years.
6.14 CHD. One-thousand people are approached to participate in a cohort study. Eight-hundred-fifty agree to participate. Fifty have evidence of coronary heart disease upon examination. Over the next ten years, 100 of the remaining individuals develop coronary heart disease.
(A) What is the 10-year incidence proportion of coronary heart disease in this cohort?
(B) What is the rate of coronary heart disease in the cohort?
6.15 Driving errors. "Every two miles, the average driver makes four hundred observations, forty decisions, and one mistake. Once every five hundred miles, one of those mistakes leads to a near collision, and once every sixty-one thousand miles one of those mistakes leads to a crash." (New Yorker, Gladwell, June 11, 2001, pp. 50-61.)
(A) What is the rate of mistakes per mile?
(B) What proportion of observations are mistaken?
(C) Why is the answer to Part A a rate and the answer to Part B a proportion?
(D) What is the odds of near collisions to actual collisions?
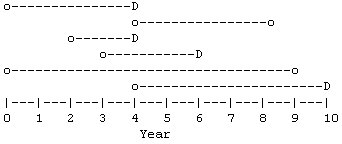
6.16. Line drawing. Here's a schematic in which "o" represents either the beginning or end of a follow-up interval and D represents disease onset.

(A) Determine the number of people in the population (N).
(B) How much person-time is there in this population?
(C)
Determine the average number of people (�) in the population.
Note: � = (sum of person-time) / (time observed).
(D) Determine the incidence rate.
6.17 Another cohort illustration. A cohort of 150 people begins with 10 cases. The cohort is followed for five years during which time 16 new cases are observed.
(A) What is the prevalence of disease at the start of the study?
(B) Assume all cases survive. What is the prevalence at the end of the study?
(C) What is the incidence proportion over the interval?
(D) What is the incidence rate over the interval?
6.18 Similar to Exercise 6.1. The figure below represents a cohort of 7 individuals observed for a year. In this figure, periods of disease are represented with a D and dashes represents disease-free periods. There are no losses to follow-up in the cohort, and we assume that recovery will confer life-long immunity.
|
Person
1 -|---------------------|-- |
(A)
What is the prevalence on Jan 1?
(B) What is the prevalence on Dec 31?
(C) Estimate the one-year risk of disease.
6.19 Just like Exercise 6.3. A population demonstrates the following vital statistics:
Total midyear population 25,000
Population size, 65-years of age or older 2,500
Number of live births 300
Total deaths (all cause) 250
Deaths in under 1-year olds 3
Deaths in persons 65 and over 75
(A) Calculate the crude birth rate per 1,000.
(B) Calculate the crude mortality rate per 1,000.
(C) Calculate the infant mortality rate per 1000.
(D)
Calculate the age-specific
mortality rate for those over 65 (per 1000).
6.20 In this schematic, dashed lines (--) represent disease-free periods and D indicates disease onset. There are three (3) people in this closed cohort, labeled A, B, and C.
|
A|--------D |
(A) What is the 5-year risk of disease in the cohort?
(B) What is the rate of the disease in the cohort?


