11: Variances and means
(Key Odd)
Review Questions
- Mean square error, mean square, residual error, variance within
groups, "squared standard deviation"; population variance (parameter) =
 2; sample variance
(statistic) = s2
2; sample variance
(statistic) = s2
- "Root mean square error"; population
standard deviation = ; sample
standard deviation = s
- When the variable has a Normal distribution.
- Chebychev's inequality.
- Additional measures of spread: (1) inter-quartile range (2) range.
- Boxplot visual clues for quantifying variability: hinge spread (i.e., IQR);
"whiskers-spread"; range (which is often equal to the whisker's
spread)
- The sum of squares is the sum of the squared of deviation around the distribution's mean.
- Recall that s2
= SS / (n - 1). Therefore, SS = (n - 1)s2
- F-ratio test (and Levene's test)
- Because pooling the variances suppress the non-uniformity of population
variances.
- False. The standard error is a measure of the mean's precision.
- df1 = 11 - 1 = 10, df2 = 10
- 1 = 9, and df = 10 + 9 = 19.
- yes, and yes.
- t16,.975 = 2.12
- H0: 21
= 22
- Under the alternative hypothesis, the variance in population 1 is
larger than (or different from) the variance in population 2.
- H0: �1 = �2 versus H1: �1
 �2
�2
- Population mean difference = �1 - �2;
sample mean difference =
 1 -
2
1 -
2
- How to compare group variability
(spreads)
(a) Descriptively (e.g., compare sample standard deviations or IQRs
(b) Graphically (e.g., side-by-side boxplots)
(c) Testing (e.g., F ratio test; Levene's test)
- How to compare group averages (central
locations)
(a) Descriptively (e.g., compare
1 and 2);
(b) Graphically (e.g., side-by-side stemplots, side-by-side boxplots, mean � SE
plots)
(c) Testing (e.g., t test)
(d) Confidence interval for �1
- �2
- It goes by various names including
"Welch's modified t" and "the unequal variance t
test". The general problem of comparing means from
populations with unequal variances is called the Behrens-Fisher problem.
Exercises
11.1 Comparing means depends on within group variability. ...we
are confident the difference observed in Comparison B is real, while the
observed difference in Comparison A might be due to chance fluctuation. Conduct
t tests (for both comparisons) to confirm this suspicion. Calculations
are shown below. Notice that even though Comparison A and Comparison B both
compare a mean of 70 to a mean of 50, Comparison A derives P = 0.081,
while Comparison B derives P = 0.002. Return to the stemplots in the
exercise to see how this relates to the variability within
groups.
11.3 Linoleic acid and LDL cholesterol
(A) Stemplot - The distribution for Group
1 is located toward the higher values (locations of medians underlined). Both distributions
may sport modest positive skews, but there are no apparent outliers. The
ranges are visible.
Group
1 | | Group 2
---------|-|---------
|4|0
|4|5
|5|04
9888|5|6
43100|6|04
75|6|
0|7|
(�1)
(B) Descriptive statistics
|
Group
|
n
|
mean
(mmol/m3)
|
s
(mmol/m3)
|
|
1
(Cases, Rassias data)
|
12
|
6.192
|
0.3919
|
|
2
(Controls, fictitious)
|
7
|
5.271 |
0.8381
|
(C) F-ratio test of
H0: 12
= 22 ;
Fstat = 0.83812 / 0.39192 =
4.573 w/ df1 = 6 and df2 = 11; 0.01 < P < 0.025.
Significant: Yes!
(D) H0: �1 = �2 vs.
H1: �1
�2 by
Welch modified t test; SEmean dif =
 (.39192 / 12 +
.83812 / 7) = 0.3364;
tstat = (6.192 - 5.271) / 0.3364 = 2.74;
df by conservative hand-based method = 6 (dfWelch = 7.56); 0.025 < P < 0.05; the observed difference seems to be significant (reject H0)
(.39192 / 12 +
.83812 / 7) = 0.3364;
tstat = (6.192 - 5.271) / 0.3364 = 2.74;
df by conservative hand-based method = 6 (dfWelch = 7.56); 0.025 < P < 0.05; the observed difference seems to be significant (reject H0)
11.5 Body weight and pituitary adenoma.
H0: 21
= 22
; Fstat = (21.4)2 / (12.4)2 = 2.98 with 11 and 4
degrees of freedom. P = 0.15. The evidence against H0 is not significant.
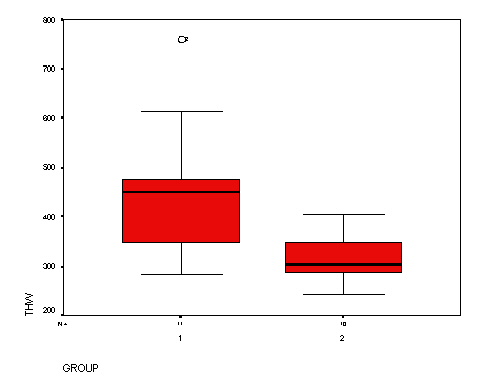
11.7 Heart size and congestive heart
failure.
- Boxplots (below) show that group 1 has higher values on average and greater
variability. The descriptive statistics (below boxplots) confirm the exploratory
finding. Also notice that group 1 has a high outside value (evident on boxplot).
- The F ratio test of H0: 21
= 22
derives Fstat = 19,415 /
2,218 = 8.75; Landmark on the table is F10,9,.95 = 3.14; P < 0.05 (P = 0.0016).
Variances differ significantly (reject H0)
- Welch modified t test of H0: �1 =
�2 derives SE = 44.573; tstat = 2.984, df =
12.452, P = 0.011. The means differ significantly.
|
GROUP |
n |
Mean |
Std. Deviation |
Std. Error Mean |
|
1 |
11 |
450.00 |
139.338 |
42.012 |
|
2 |
10 |
317.00 |
47.093 |
14.892 |
11.9 Efficacy of echinacea (severity of symptoms.)
-
H0: 12
= 22 :Fstat= 1.09 with numerator
df1 = 369 and denominator df2
= 336;
P-value = 0.4264 Therefore, the variances to not differ significantly,
and either t test can be used. We will use the unequal variance
(Welsh) t test.
- H0: �1 = �2
vs. H0: �1
�2; use the unequal variances tstat = -0.5656
with dfW = 703.2 and P-value =
0.5719(calculated with SPSS v. 11). The conservative estimate is dfcons
= 335. You can use the line that says " z" (or use a
z table) for t statistics with more than 100, so P > 0.40.
This
reveals no significant difference between the echinacea and the placebo
group.
Comment: The
published source (Taylor
et al., 2003) gives P = 0.68 for a Cox regression for censored
data. Our method is a simplification and uses rounded summary statistics ( reported in Table 2 of
Taylor et al., 2003 ) but comes up with an equivalent answer. (I requested the original data from the author via email on 8/31/06,
but have yet to receive a response.)
11.11 The effect of calcium
supplementation on blood pressure. See the boxplot shown
below. Notice that the calcium-supplemented group has a higher average
and (perhaps?) more variation. Also notice the outside value in the placebo group.