Chapter 8 Key (Odd)
(8.1) REVIEW QUESTIONS
(A) Independent samples represent random observations from separate unrelated
populations. Paired samples represent matched or natural couples.
(B) (a) independent (b) paired (husband/wife pairing) (c) independent (d)
independent (e) paired
(C) You would use one variable to store the outcome and a separate variable to store the group indicator.
(D) One variable (let's call it ANXIETY) would contain information about anxiety
score and a binary variable (STU_TYPE) would contain information
about whether the student was an undergrad or grad student (1 = undergrad, 2 =
grad).
(E) Boxplots are plotted side-by-side. You then make a visual
comparison of hinge-spreads and whiskers-spreads. If these spread differ
greatly, you have evidence of unequal variance within groups. This technique is
reliable only when samples are large.
(F) The sample mean difference ( 1
- 2).
1
- 2).
(G) d
(H) b
(I) c
(J) df = df1
+ df2 = (n1 - 1) + (n2 - 1)
(K) We are 95% confident that �1 - �2
(the true population mean difference) lies
between -3.3 and 1.7.
(L) The mean in population 1 is equal to the mean in population 2
(or their difference equals 0).
(M) H0: �1 = �2
(or H0: �1 - �2 =
0)
(N) Independent samples; Normality; Equal variance
(O) True
(P) You conduct sample size calculations before a study is begun so you study
will have sufficient power or be sufficiently precise.
(Q) You need to specify (a) the standard deviation of the variable, (b) the size
of the difference you want to detect, (c) the alpha level of the test, and (d)
the required power.
(8.3) TWOGRPS
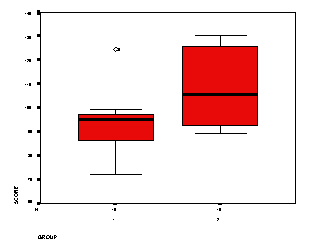
(A) Side-by-side boxplot
Calculations for group 1:
IQR = 97 - 86 = 11
FL = 86 - (1.5)(11) = 69; no lower outside values
FU = 97 + (1.5)(11) = 113.5; one upper outside value of 125, upper inside value is 99
Calculations for group 2:
IQR = 129 - 93 = 33
FL = 93 - (1.5)(33) = 43.5; no lower outside values
FU = 126 + (1.5)(33) = 175.5; no upper outside values
Interpretation: Group 1 has a lower average (median) value. In
addition, the boxes hardly overlap. This provides evidence that
distribution 1 is located to the left of distribution 2. Group 1 has a
smaller IQR but a greater range that group 2. |
 |
(B) Hypothesis Test
s2p = [(10 - 1)(14.862) + (10 - 1)(15.372)] / [(10 - 1) + (10 - 1)] = 227.935
se =  [227.935 * (1/10 + 1/10)] = 6.76
H0: �1 = �2 = 0 vs. H1: �1
 �2
�2
Let a = .05
tstat = (93.3 - 107.6) - 0 / 6.76 = -2.115, df =
18
.01 < p < .05
Therefore, reject H0.
(8.5) JOGGERS
(A) 95% CI for �1 - �2
- s2pooled = [4.82(24) + 5.12(25)] / [24 + 25] = 24.60
- se = sqrt[24.60 (1/25 + 1/26)] = 1.389
- t49,.975 @ t40,.975 = 2.02
- 95% CI for �1 - �2 = (47.5 - 37.5) � (2.02)(1.389) = 10.0 �
2.8 = (7.2, 12.8)
Interpretation: With 95% confidence we can say the mean difference
in V02 uptake in joggers and non-jogger populations
is between 7.2 and 12.8.
(B) 99% CI for �1 - �2
- t49,.995 @ t40,.995 = 2.70
- 99% CI for �1 - �2 = (47.5 - 37.5) � (2.70)(1.389) = 10.0 � 3.8 = (6.2, 13.8)
Interpretation: This confidence locates the population difference with 99%
confidence.
(8.7) CMV. Luminal diameter reduction (mm) of coronary arteries.
s2p = 0.616
se mean dif = .1904
H0: �1 = �2
vs. H1: �1 not = �2
a = .05
tstat = (1.24 - 0.68) / (.1904) = 2.94;
df = (49 - 1) + (26 - 1) = 73;
[draw curve, locate tstat in right tail, and then determine
using t table that the two-sided p < .01)
Reject
H0
Interpretation: The study shows that the the CMV+ group had significantly greater luminal reduction than the CMV- negative
group.
(8.9) ASPIRIN
H0: H1: �1 = �2
vs. H1: �1 not = �2
a = .05
tstat = 0.86; df = 45; [draw curve and locate the tstat
.86 standard error units to right of center];
p > .2
retain H0 is
(8.11) INDTSIZE
n = [(16)(402) / 102] + 1 = 257