(1) UNICEF.REC
(A) Laos has the highest low birth weight rate (39%); Spain has the lowest (1%).
(B) The United States has a rate of 7% which is greater than or equal to 36.7% of the other observations. Therefore it is no more than
the 36.7th percentile.
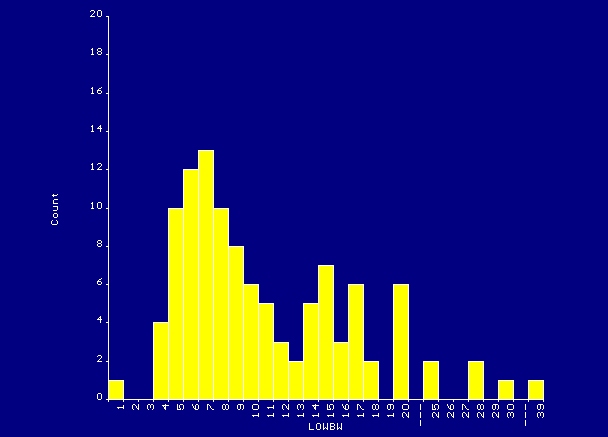
(C) Histogram - click here. Data are "skewed right."
(D) Summary stats: n = 109, mean = 11.147, SD = 6.417, min = 1 max = 39
(E) A 95% CI for � = (9.9, 12.4). Comment: Even though data are skewed, the sample is large enough (n = 109) to allow a normally
based confidence interval.
(3) SERZINC.REC
(A) Descriptive stats reported by Epi Info
Total Sum Mean Variance Std Dev
462 40627 87.937 256.150 16.005
Minimum 25%ile Median 75%ile Maximum
50.000 76.000 86.000 98.000 153.000
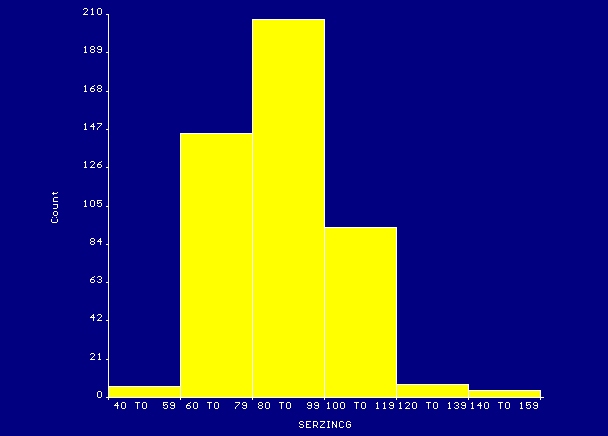
(B) Frequency analysis and histogram -- see serzinc.pgm for commands used to produce output
SERZINCG | Freq Percent Cum.
-----------+-----------------------
40 TO 59 | 6 1.3% 1.3%
60 TO 79 | 145 31.4% 32.7%
80 TO 99 | 207 44.8% 77.5%
100 TO 119 | 93 20.1% 97.6%
120 TO 139 | 7 1.5% 99.1%
140 TO 159 | 4 0.9% 100.0%
-----------+-----------------------
Total | 462 100.0%
Click here for histogram.
(C) 95% CI for �:(86.5, 89.4)
(D) H0: � = 85 vs. H1: � not = 85; let a = .05; tstat = 3.95, df = 461; p = .00009, reject H0. A significant difference between the
hypothesized population mean of 85 and the sample mean of 87.9 was found.